Bitcoin Price Prediction: BTC Up to $64,000 Amid US Unemployment Spike; Buy Now?
Critical U.S. economic data was released on Thursday, July 18, potentially influencing Bitcoin price prediction. The unemployment claims came in higher than expected at 243,000, up from 229,000 previously, indicating a weakening job market.
Additionally, the Philly Fed Manufacturing Index showed significant improvement, rising to 13.9 from 2.7, signaling robust industrial growth.
The CB Leading Index, although slightly improved, still reflected a negative trend at -0.2%.
These mixed economic signals can impact Bitcoin in various ways. Higher unemployment claims may increase uncertainty in traditional markets, driving investors towards alternative assets like Bitcoin.
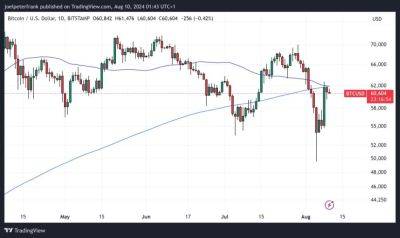
Bitcoin (BTC/USD) is currently trading at around $64,040, with a 24-hour trading volume of $26.51 billion.
Over the last 24 hours, Bitcoin has declined by 1.20%. It remains the top-ranked cryptocurrency on CoinMarketCap, boasting a market capitalization of $1.26 trillion.
There are 19.73 million BTC coins in circulation, nearing its maximum supply of 21 million BTC coins.
The 2-hour chart reveals that Bitcoin is finding support near the $63,500 mark.
This level is reinforced by an upward trendline and the formation of a hammer candle, which typically indicates potential for an upward movement.
Additionally, Bitcoin is sitting above its 50-day Exponential Moving Average (EMA) of $63,540, adding to the positive outlook.
Key price levels to monitor include the pivot point at $63,540. Immediate resistance is found at $65,120, with higher resistance levels at $66,940 and $68,940.
On the downside, immediate support is at $63,330, followed by $62,460 and $61,590. These levels are crucial for understanding Bitcoin’s next potential movements.
The Relative Strength Index (RSI) is
Read more on cryptonews.com


