Is Pepe Going on Another Bull Run? PEPE Surges 5% While Crypto Trader Platform Presale Finds Strong Support
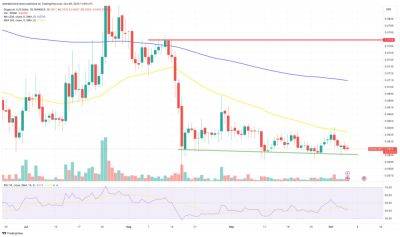
PEPE has flashed signs of life after its drawn-out decline to three lol-month low on September 17. Its 16% dead cat bounce since the bottom has now run into stiff overhead resistance, however.
With PEPE still languishing below its key 20-day EMA, traders are left on edge wondering if this bounce will reverse or if the bottom will fall out again.
At a critical technical junction, the next move could set the tone for PEPE's trajectory in the coming weeks. Whether bulls or bears prevail may come down to how PEPE handles its near-term support and resistance levels.
The 20-day EMA for the PEPE price is at $0.0000007105, below the 50-day EMA of $0.0000008698 and the 100-day EMA of $0.0000010661. Typically, when the short-term EMA is below the long-term EMA, it's seen as a bearish sign.
However, the PEPE price is currently in proximity to the 20-day EMA, indicating a possible breakout.
The RSI stands at 43.11, down from yesterday's 44.63, suggesting that the PEPE price is in a neutral zone, neither overbought nor oversold.
The MACD histogram is at 0.0000000204, up from yesterday's 0.0000000196, indicating a slight bullish momentum.
The market cap is up by 1.66% to $273.6 million, while the 24-hour volume is down by 6.37% to $61.4 million.
This mixed signal indicates that even though the PEPE price is attracting capital, it's doing so with less trading activity. This could be interpreted as a cautious sentiment among traders.
Resistance for the PEPE price lies at the 20-day EMA of $0.0000007105, followed by a significant resistance zone ranging from $0.0000006975 to $0.0000008295, in confluence with the Fib 0.236 level of $0.0000008002. PEPE could signal an upward trend if it breaks through this resistance zone.
On the flip side, an
Read more on cryptonews.com


